
Working with lists
Every list in the dashboard (patients, caregivers, visits, users, services…) works the same way. Learn it once here.
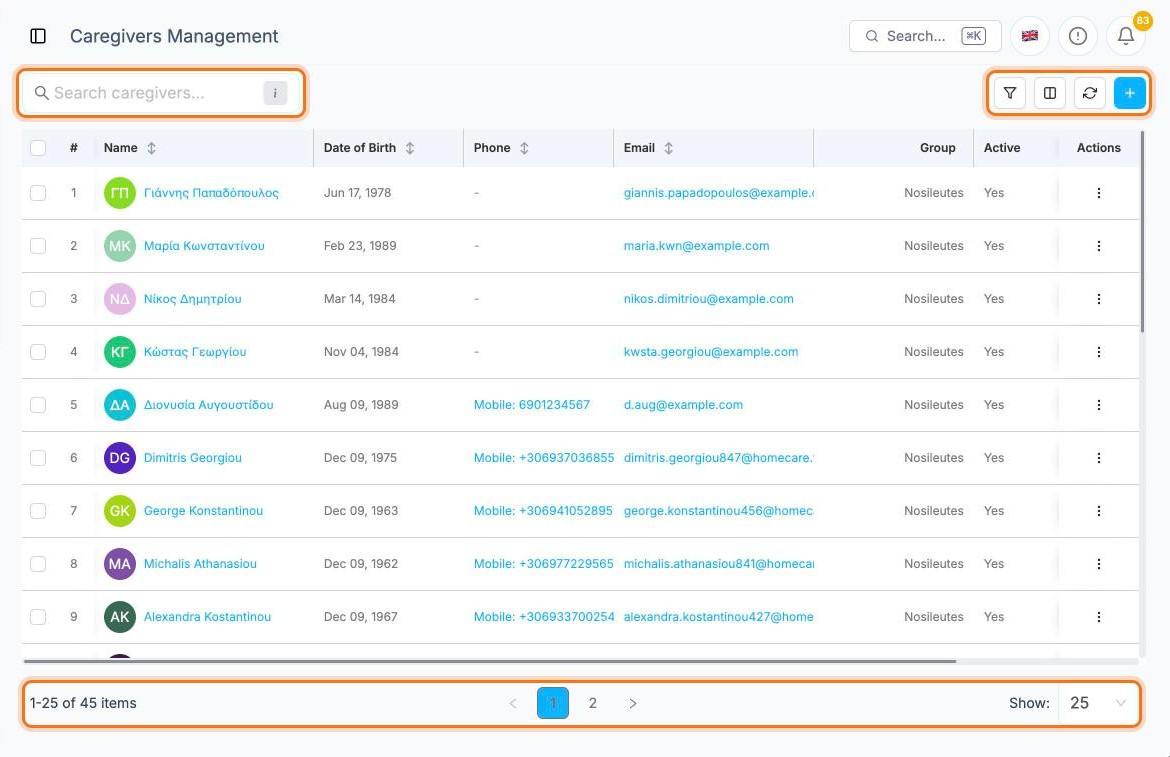
A list has three areas:
- Search at the top left
- the toolbar at the top right: filters, columns, refresh and + to add a new record
- pagination at the bottom: the item count, page numbers and Show for rows per page
Click a name in the list to open that record. The ⋮ button at the end of a row has more actions.
Show, hide and reorder columns
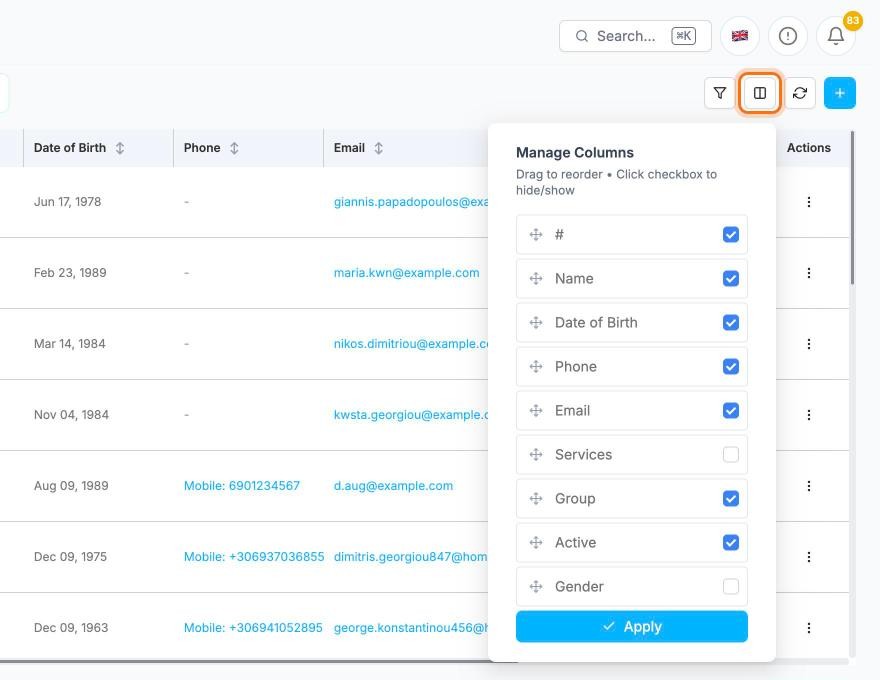
Click the columns button in the toolbar. In Manage Columns:
- tick or untick a column to show or hide it
- drag a column by its ✥ handle to move it
Click Apply. Your layout is saved in this browser, so the list looks the same next time.
Search
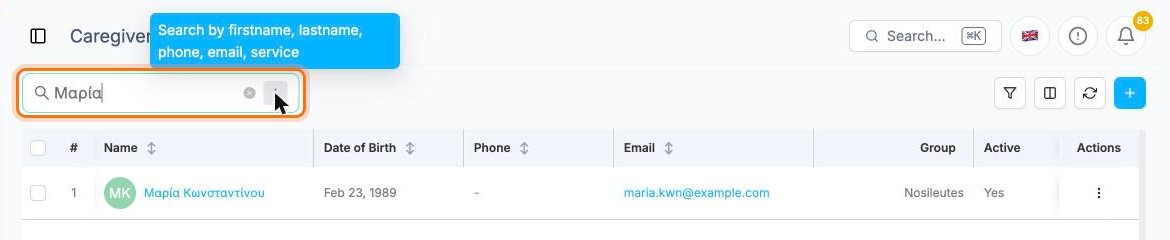
Type in the search box. Results update after 3 characters. Hover the i icon to see which fields are searched (for caregivers: first name, last name, phone, email and service).
Click the × in the box to clear the search.
Advanced filters
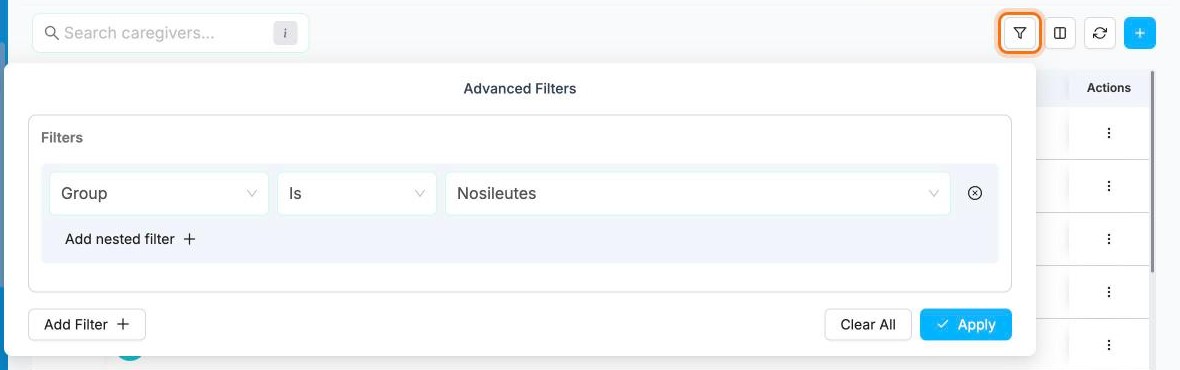
Click the filter button in the toolbar to open Advanced Filters:
- Select a column, for example Group
- choose the condition, for example Is
- pick or type the value
- click Apply
Use Add Filter to combine several conditions, and Add nested filter to group conditions together. Clear All removes every filter.
While filters are on, the filter button turns blue and shows how many are active. Click the small × on it to remove them all at once.
TIP
Search, filters, sorting and the page you're on are all kept in the address bar. Copy the link to share exactly the same view with a colleague.
Sort
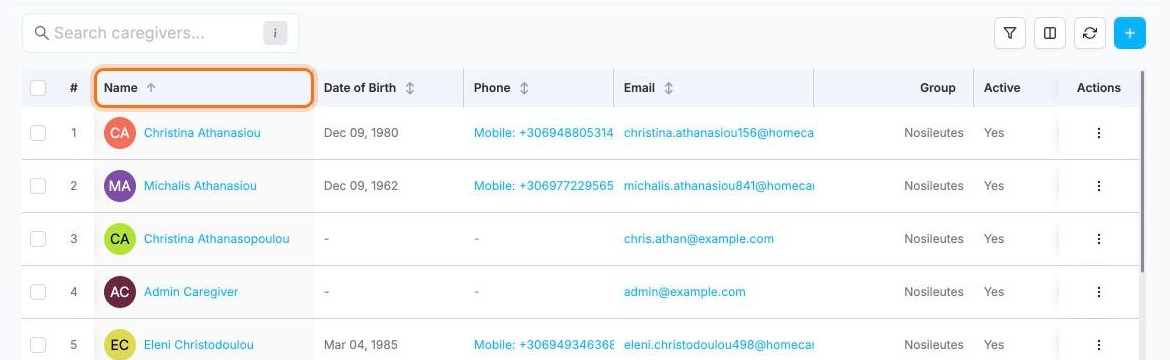
Click a column header to sort by it. Click again to reverse the order, and a third time to remove the sorting. The arrow next to the header shows the current direction.
Totals at the bottom of the list
Lists with money columns (for example Visit List and Service Request List) have a summary row at the bottom.
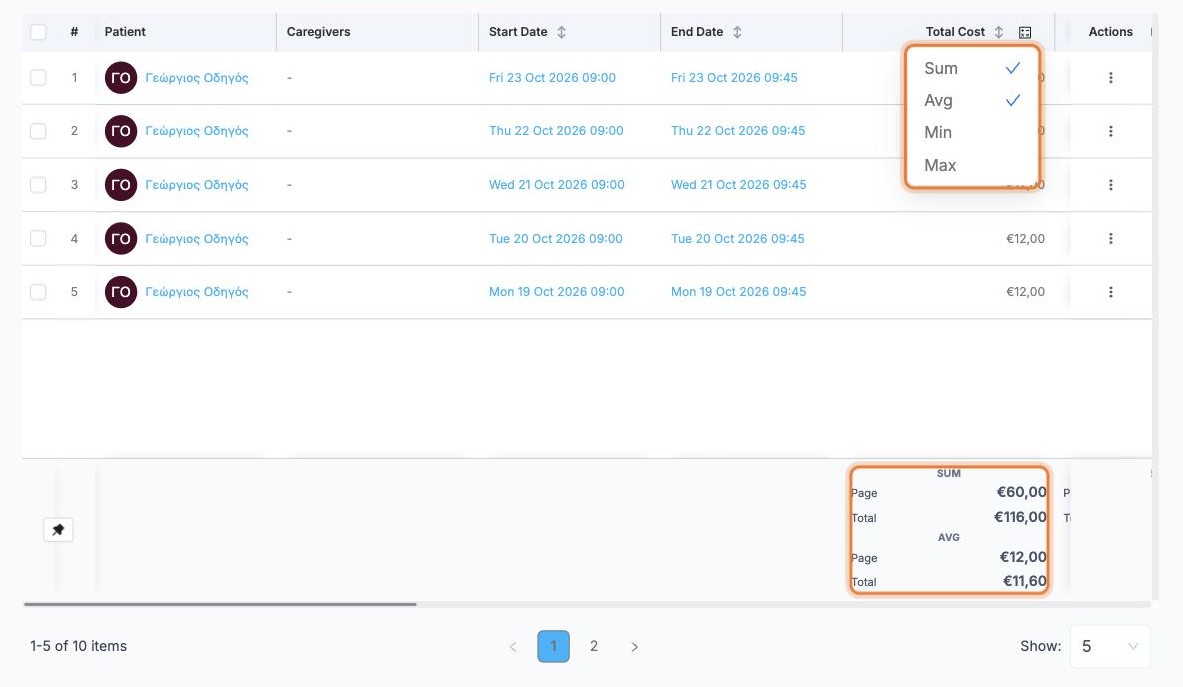
Each figure is shown twice:
- Page: only the rows on the page you're looking at
- Total: every row that matches your current search and filters, across all pages
To choose what is calculated, click the small calculator icon next to the column title (tooltip Aggregations) and tick Sum, Avg (average), Min or Max. You can tick more than one, and each gets its own block in the summary row.
The pin button at the left of the summary row keeps it fixed at the bottom while you scroll. Click it again to unpin.
TIP
Filter first, then read the Total: for example, filter the Visit List to one caregiver and one month to see the total cost of their visits.
Export to Excel
Set up the list the way you want it first: the export uses the columns you can see, plus your current search, sorting and filters.
- Click Export in the toolbar.
- Choose Excel (.xlsx) or CSV.
- Click Export.
The file is prepared in the background, so you can keep working. When it's ready, an Export Ready notification appears under the bell in the top bar. Open it and click Download Export File.
WARNING
If you hide every column, there is nothing to export. Show at least one column first.